

Event Analytics
All the statistics you need in one place to help you manage your events

Get an instant snapshot of your event
Track key metrics such as the total number of registrations, sales by registration types, total income, percentage of the total ticket allocation sold, and latest orders.
View the headline figures and download reports from one screen.
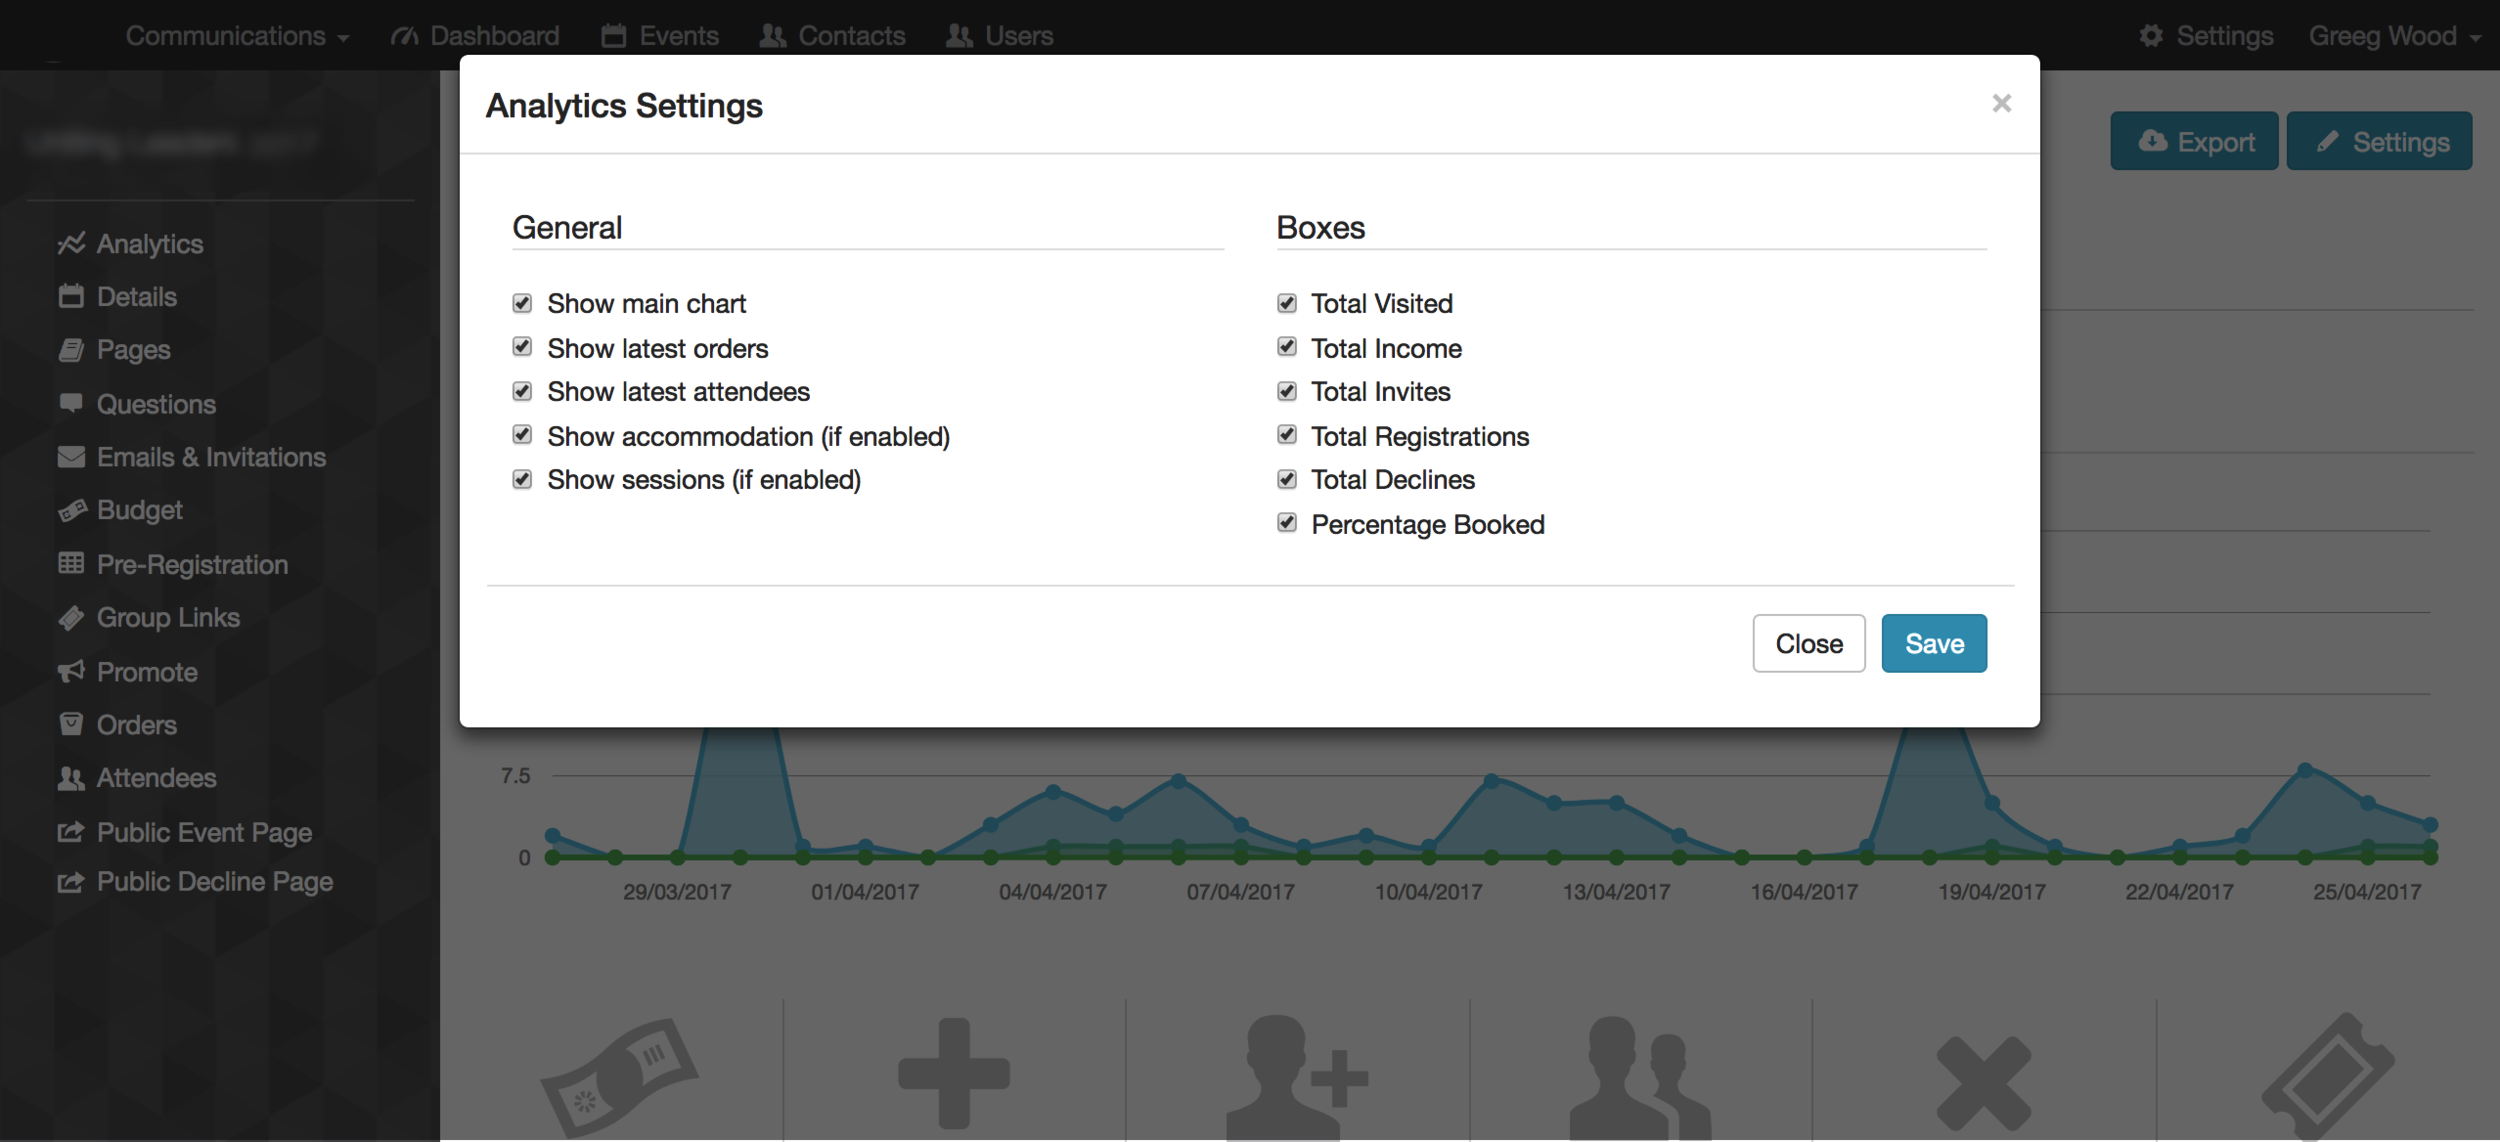
Choose what you see
Select which metrics you’d like to see. For example, if the event is free to attend, you won’t need or want to see the Total Income displayed.
Keep it simple, only see what you need to see.

A one-page event summary
Get all the key information you need from one page.
Drill down into the details by clicking on the headline figure.

Custom report builder
Mitingu's custom report builder gives you the information you need from your event.
Unlimited customised reports
Select your own dates and criteria for each report
Real time updates
Export as a spreadsheet